Homelab Adventures Part 4 – The Dashboard
Now you have a functional homelab, but how do you make sure it stays functional? It’s been a while since I completed the initial setup of the homelab, and it’s been serving my family and I well. However, I wanted to revisit how I keep track of metrics and performance. Previously, I used Homarr and Dash. for this, but I wanted to try and implement a Grafana dashboard instead, since it is more customizable. This does double duty of improving the way I monitor my homelab and helping me learn Grafana. Grafana is a popular tool nowadays, and I want to at least be familiar with the basics.
From what I could tell based on my research, I would need to add two services to my homelab. The first is called Prometheus, and it serves as a database for the metrics. It does not do any data visualization though. For that, I also need an instance of Grafana, which uses Prometheus as a data source. There is also a service known as an “exporter,” that helps expose data for Prometheus to find and aggregate. Simple. I followed a guide from Christian Lempa to put this into practice.
The guide from Christian Lempa is four years old, but still holds up very well. Ultimately, there are two of my own notes I wanted to add to it.
- For some reason, the recommended setup for cAdvisor on his GitHub uses the host networking mode. This is not how it is set up in his video, and causes problems, since when you try and connect it to Prometheus, it won’t register with service name because it is not on the same docker network.
- Make sure you use the most recent version of cAdvisor.
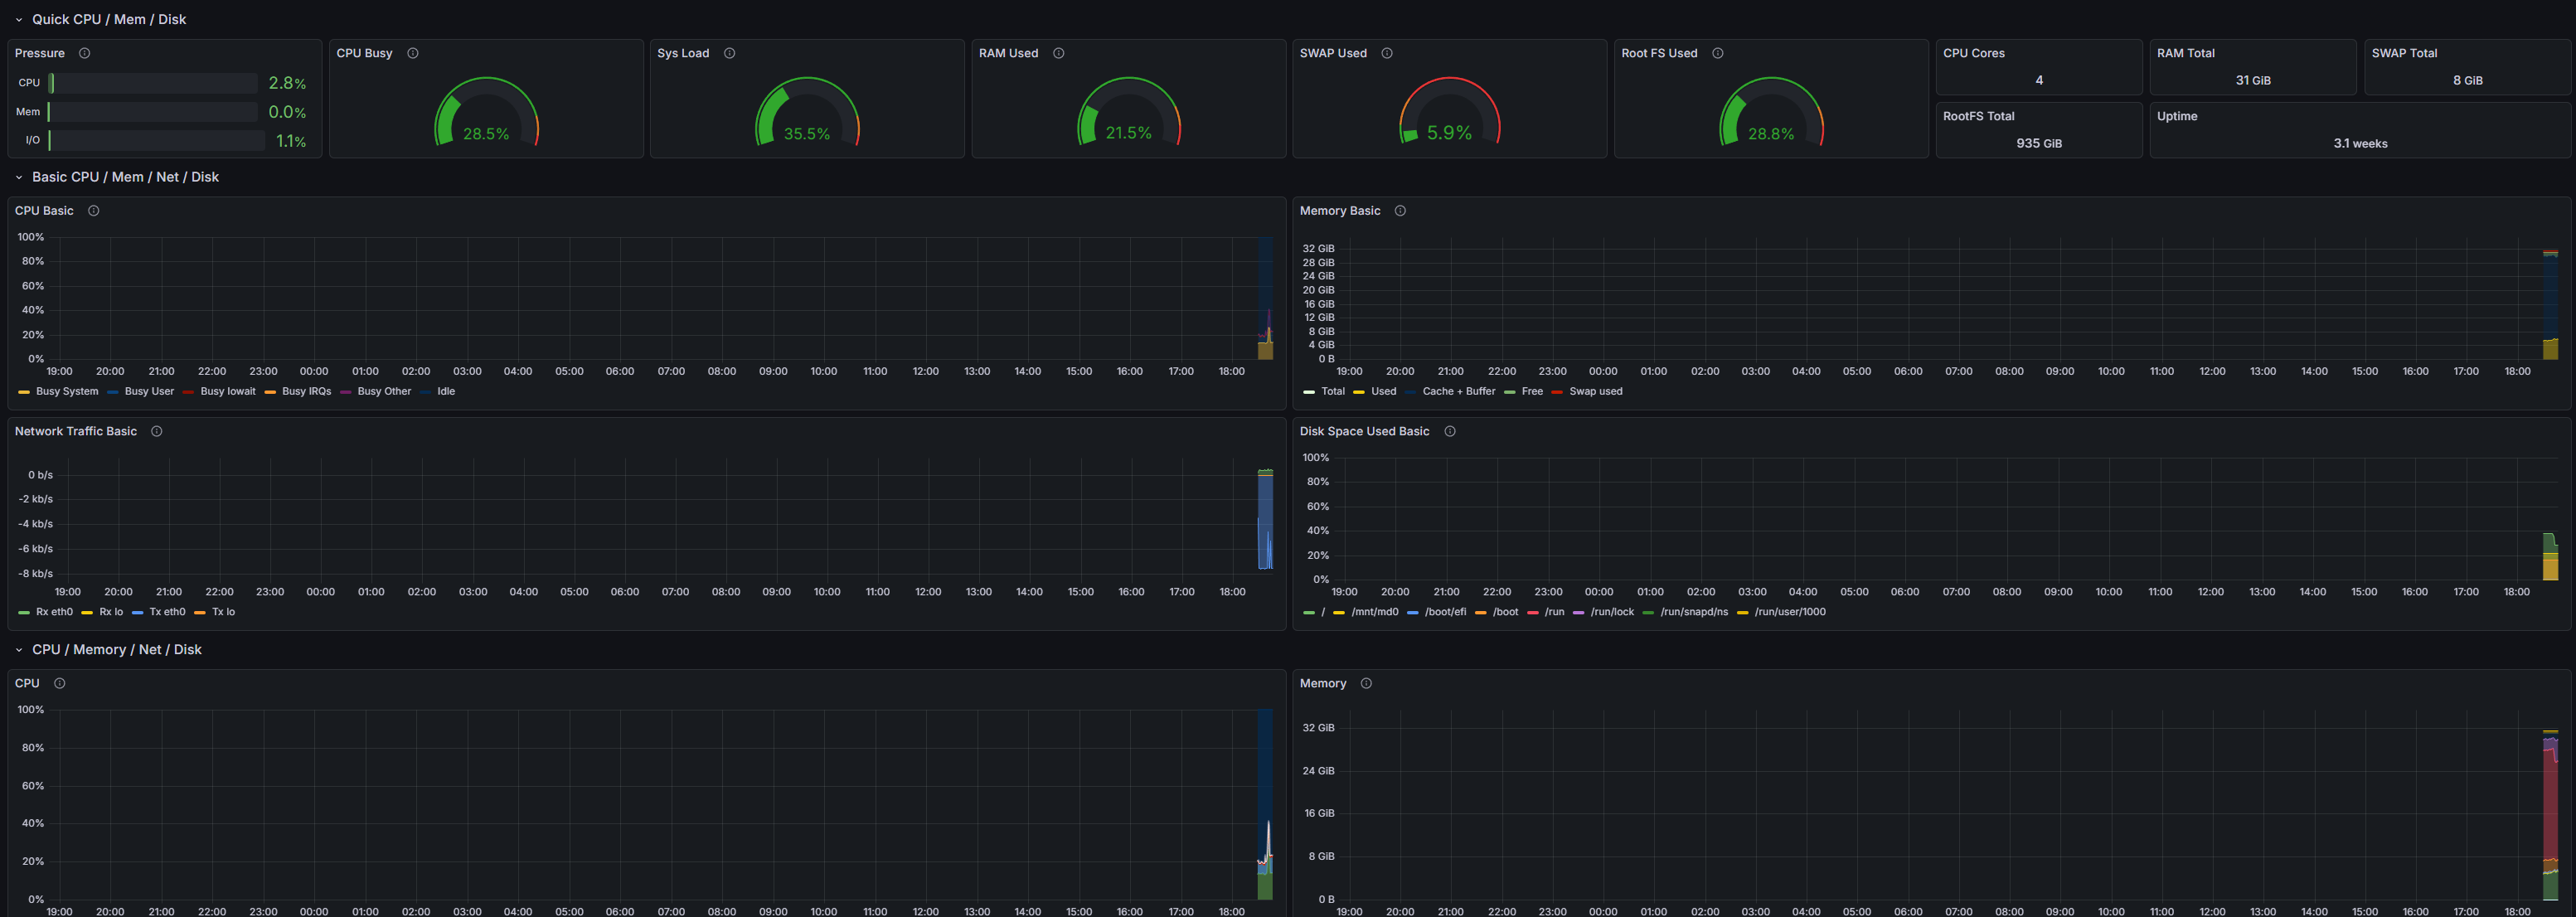
Now, I have my own Grafana instance with the Prometheus data source that allows me to access any data related to the host (node-exporter) and my docker containers (cAdvisor). I imported some dashboards to start, but I am excited to really make it my own. I also heard that while Prometheus is good for metrics, you can also use other services, like Grafana Alloy, Loki, Tempo, etc., in order to track logs and traces as well as metrics and get a really complete overview of what is going on with your server. I think this is good for now, but that is something to consider. Check out my new dashboard!


Leave a comment